Instagram Statistics 2026: Users, Reels, Engagement & Revenue Data
Essential Instagram statistics for 2026. 2.0B monthly users, 33 min/day usage, 1.74% Reels engagement, 1.92% carousel engagement, Reels data, ad benchmarks, and creator economy stats.
FlowShorts Team

Instagram has 2.0 billion monthly active users as of Q1 2026, making it the third-largest social platform globally after YouTube and Facebook. But raw user count doesn't tell the story creators and marketers need. This page covers the stats that actually matter: engagement rates, Reels performance, ad benchmarks, creator economy data, and how Instagram compares to TikTok and YouTube for distribution in 2026.
Instagram User Statistics 2026
Monthly and Daily Active Users
- Monthly active users (MAU): 2.0 billion (Q1 2026)
- Daily active users (DAU): ~700 million
- US monthly active users: 169 million
- Average daily time spent: 33 minutes
- Sessions per day per user: ~6-8
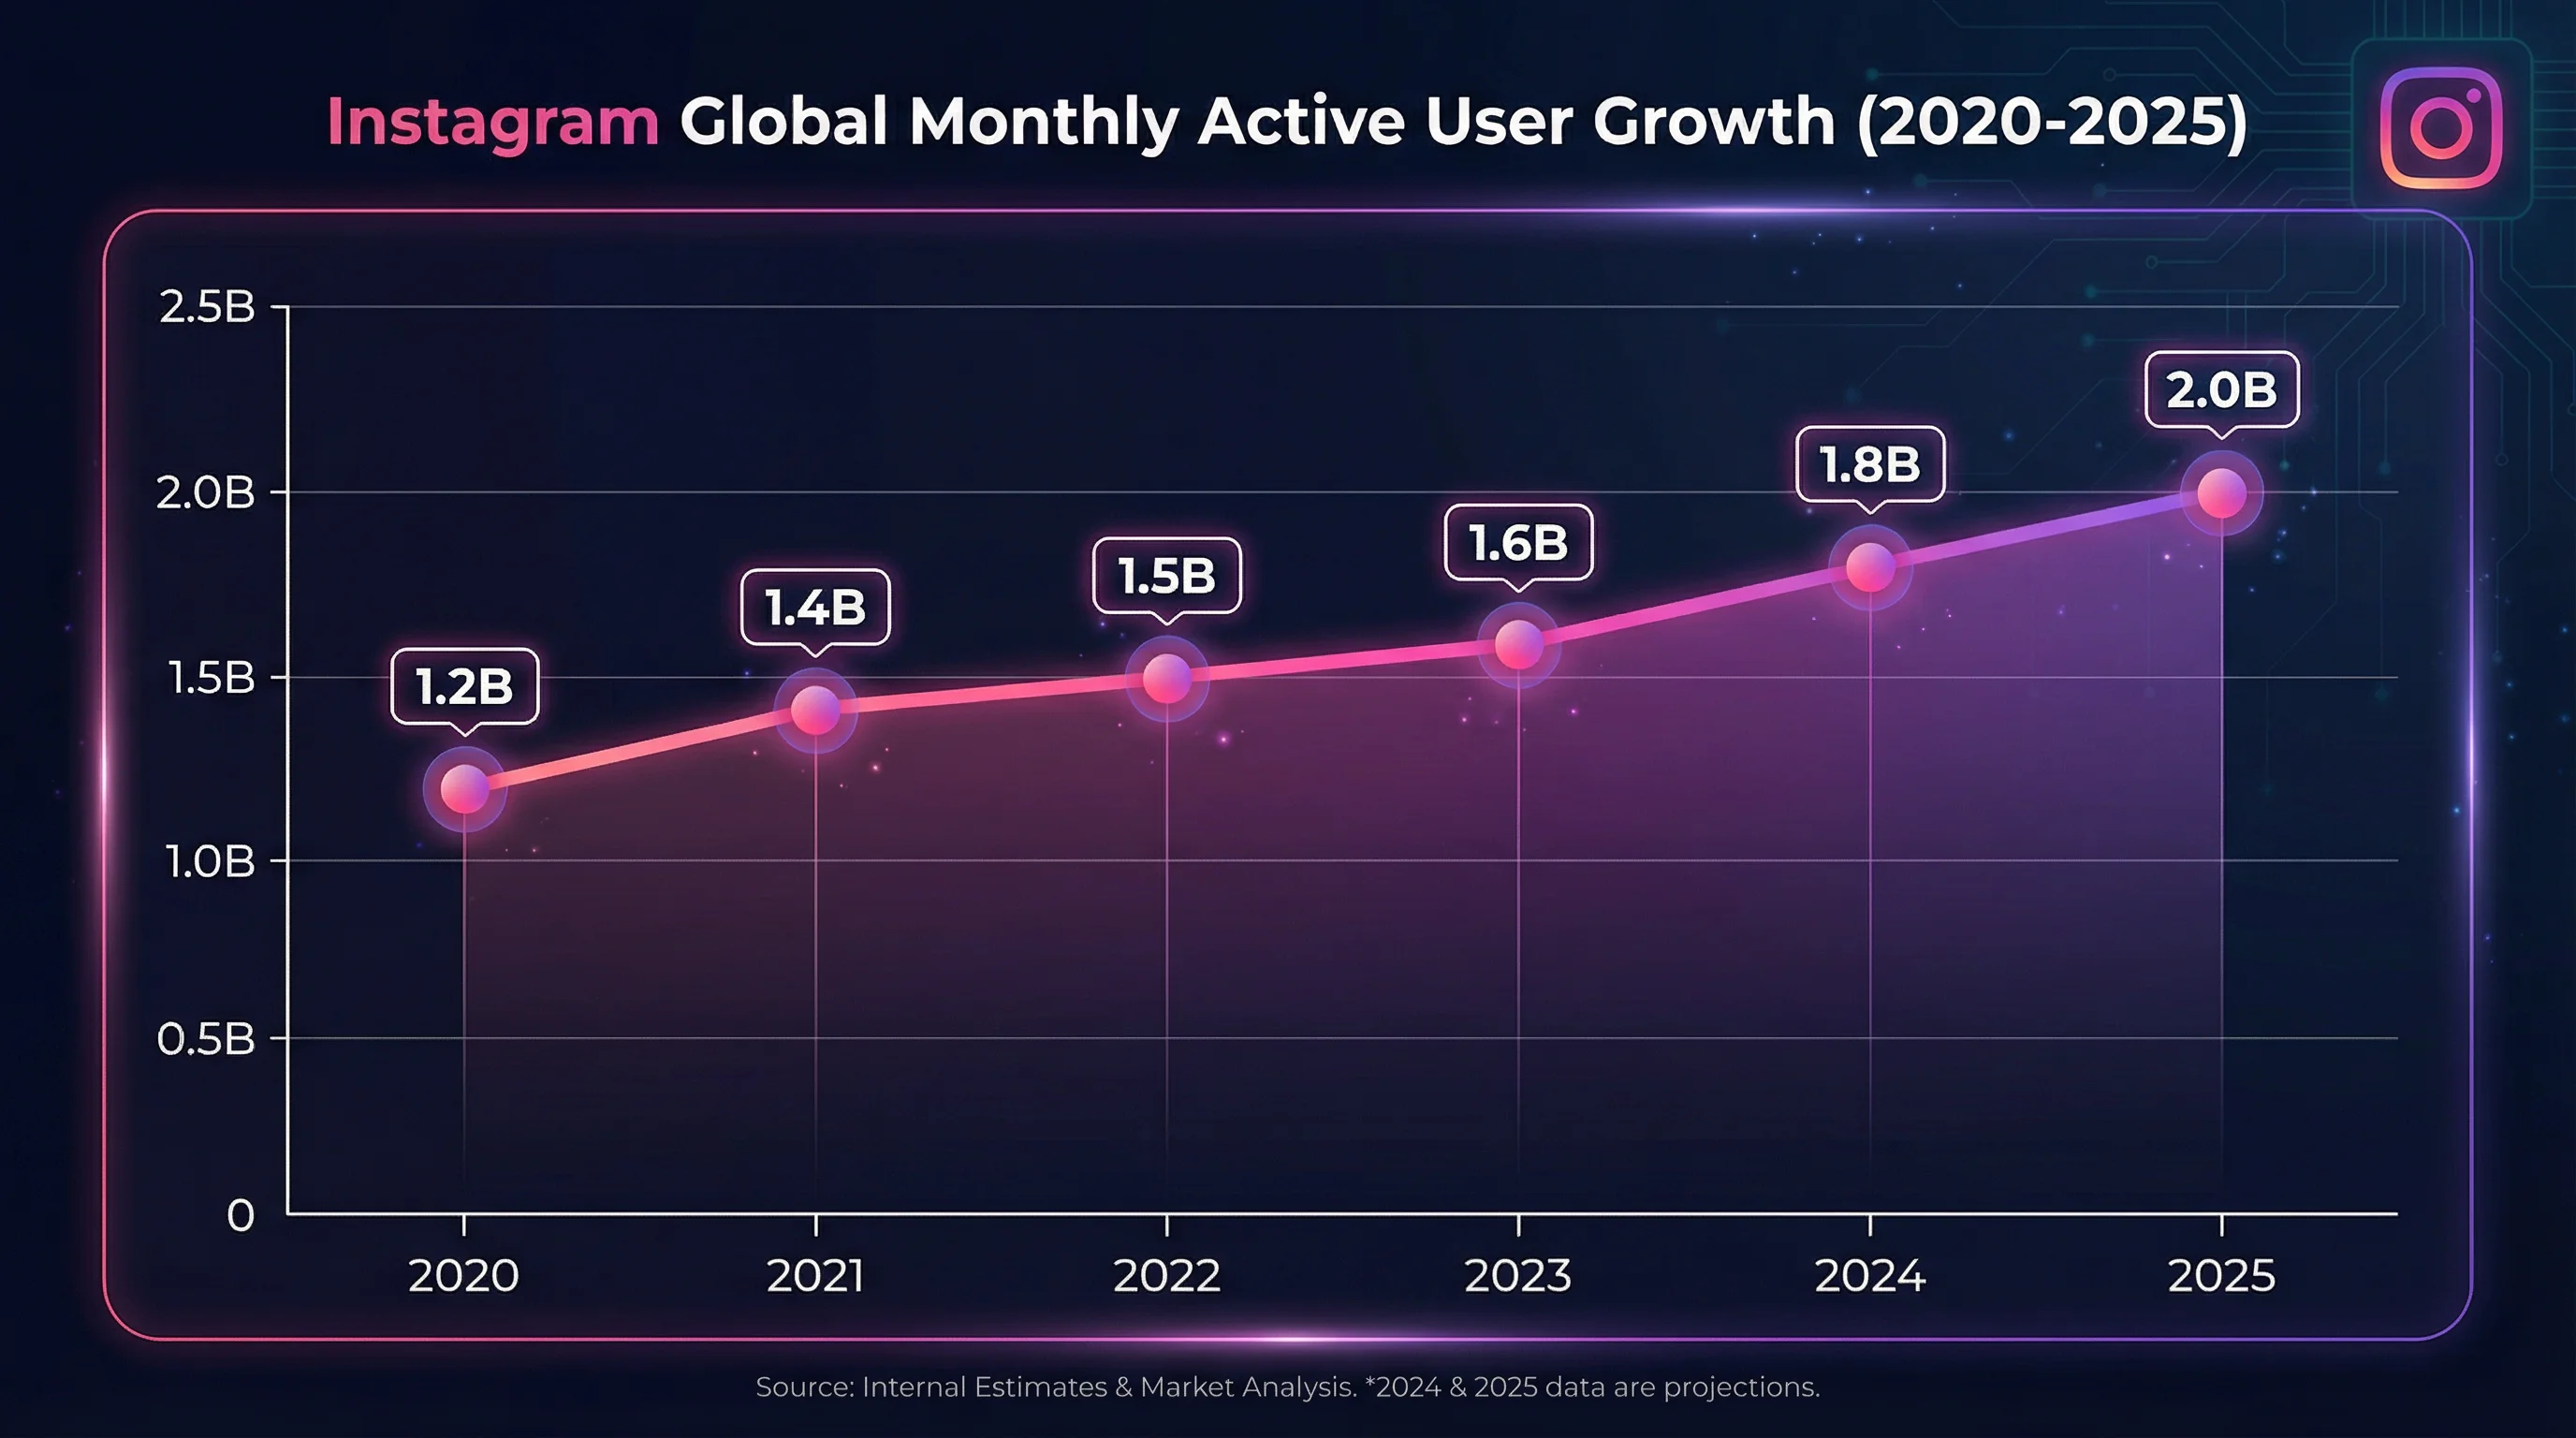
Instagram User Growth (2020-2026)
| Year | Monthly Active Users | Year-over-Year Change |
|---|---|---|
| 2020 | 1.08 billion | +7.1% |
| 2021 | 1.22 billion | +13.0% |
| 2022 | 1.35 billion | +10.7% |
| 2023 | 1.65 billion | +22.2% |
| 2024 | 1.83 billion | +10.9% |
| 2025 | 1.95 billion | +6.6% |
| 2026 (Q1) | 2.0 billion | +2.6% |
Growth is decelerating as the platform approaches market saturation in its primary demographics. Instagram is no longer the hyper-growth platform it was in 2021-2023 — but 2 billion MAU is a stable, massive audience.
Instagram Demographics
Age Distribution
| Age Group | Share of Users |
|---|---|
| 13-17 | 8.2% |
| 18-24 | 31.1% |
| 25-34 | 30.9% |
| 35-44 | 16.4% |
| 45-54 | 8.8% |
| 55+ | 4.6% |
The 18-34 cohort represents 62% of Instagram's user base — the most commercially valuable demographic online. This is the primary reason Instagram commands premium advertising rates despite its smaller user base versus Facebook.
Gender Split
- Male users: 51.8%
- Female users: 48.2%
Top Countries by Users
| Country | Users |
|---|---|
| India | 362 million |
| United States | 169 million |
| Brazil | 134 million |
| Indonesia | 100 million |
| Turkey | 58 million |
| Mexico | 40 million |
| Japan | 37 million |
| United Kingdom | 33 million |
Instagram Reels Statistics
Reels is the dominant format on Instagram in 2026. Meta has consistently stated that Reels growth is a priority, and the algorithm distribution for Reels significantly outperforms other formats.
- Reels share of Instagram time: ~50% — half of all time spent on Instagram is spent watching Reels
- Reels shares per day: 2 billion (Meta, 2025 earnings report)
- Average Reels engagement rate: 1.74%
- Average Reels reach rate: 30.81% (significantly higher than Feed posts or Stories)
- Most-watched Reels length: 7-15 seconds (highest completion), 30-60 seconds (highest engagement per play)
Create Faceless Videos on Autopilot
FlowShorts generates and posts AI videos to YouTube, TikTok & Instagram while you sleep.
Try FlowShorts Free →Engagement Rate Benchmarks by Format
| Format | Average Engagement Rate | Average Reach Rate |
|---|---|---|
| Reels | 1.74% | 30.81% |
| Carousel | 3.15% | 20.40% |
| Static Image | 1.83% | 13.20% |
| Stories | 0.80% (of follower base) | Followers only |
Key insight: Carousels have higher engagement rate than Reels, but Reels have much higher reach rate. For growing followers and reaching non-followers, Reels are the strongest format. For engaging existing followers, Carousels win. For a comprehensive breakdown of how content spreads on Instagram, see our Instagram algorithm guide.
Instagram Engagement Statistics by Account Size
| Account Size | Average Engagement Rate | Notes |
|---|---|---|
| 1K-10K followers | 3.5-6% | Micro accounts have highest rates — smaller, tighter audiences |
| 10K-100K followers | 1.5-3.5% | Mid-tier: algorithm distribution grows but audience breadth reduces rate |
| 100K-1M followers | 0.8-2% | Large accounts: reach is massive but engagement rate naturally declines |
| 1M+ followers | 0.3-1% | Celebrity/mega accounts — absolute engagement numbers are huge despite low rate |
Engagement rate declines with account size — this is expected and doesn't indicate underperformance. Compare your engagement rate to accounts of similar size, not to absolute benchmarks.
Instagram Usage Behavior
- Average time per session: ~5-6 minutes
- Average sessions per day: ~6-8
- Total daily time spent: 33 minutes (global average)
- Peak usage hours: 11am-1pm and 7pm-9pm (local time, varies by region)
- Percentage using Stories daily: ~70% of accounts
- Percentage of feed that is Reels: ~50% (up from ~15% in 2022)

Instagram Revenue and Advertising Statistics
- Instagram ad revenue 2025: ~$40 billion
- Share of Meta's total revenue: ~25-28%
- Average CPM (cost per 1,000 impressions): $8.45
- Average CPC (cost per click): $1.28
- Average CTR for Instagram ads: 0.67%
- Reels ad average engagement rate: Higher than Feed ads (Meta's own data suggests ~15-20% better performance)
Advertising CPM Benchmarks by Industry
| Industry | Average CPM | Average CPC |
|---|---|---|
| E-commerce | $6-12 | $0.75-1.50 |
| Finance / Insurance | $15-30 | $2.00-5.00 |
| B2B Software | $12-25 | $3.00-8.00 |
| Retail / Fashion | $5-9 | $0.50-1.25 |
| Health & Beauty | $7-14 | $1.00-2.50 |
| Entertainment | $4-8 | $0.50-1.00 |
Instagram Creator Economy Statistics
- Creators on Instagram: ~68 million
- Accounts considered "influencers" (10K+ followers): ~8.5 million
- Average sponsored post rate (nano, 1K-10K followers): $25-200 per post
- Average sponsored post rate (micro, 10K-100K followers): $150-2,000 per post
- Average sponsored post rate (macro, 100K-1M followers): $2,000-50,000 per post
- Average sponsored post rate (mega, 1M+ followers): $10,000-100,000+ per post
| Influencer Tier | Followers | Avg Sponsored Post Rate | Avg Engagement Rate |
|---|---|---|---|
| Nano | 1K-10K | $25-200 | 5-10% |
| Micro | 10K-100K | $150-2,000 | 2-5% |
| Mid-tier | 100K-500K | $2,000-15,000 | 1-3% |
| Macro | 500K-1M | $15,000-50,000 | 0.8-2% |
| Mega | 1M+ | $50,000-250,000+ | 0.5-1.5% |
Content Statistics
- Photos/videos shared per day: ~100 million
- Instagram Stories shared per day: ~500 million
- Most common content type: Reels (by distribution share)
- Hashtags per post (optimal for reach): 3-5 (2026 data — more does not correlate with better reach)
- Optimal Reels length for engagement: 30-60 seconds
- Optimal Reels posting frequency for growth: 4-7 per week
Create Faceless Videos on Autopilot
FlowShorts generates and posts AI videos to YouTube, TikTok & Instagram while you sleep.
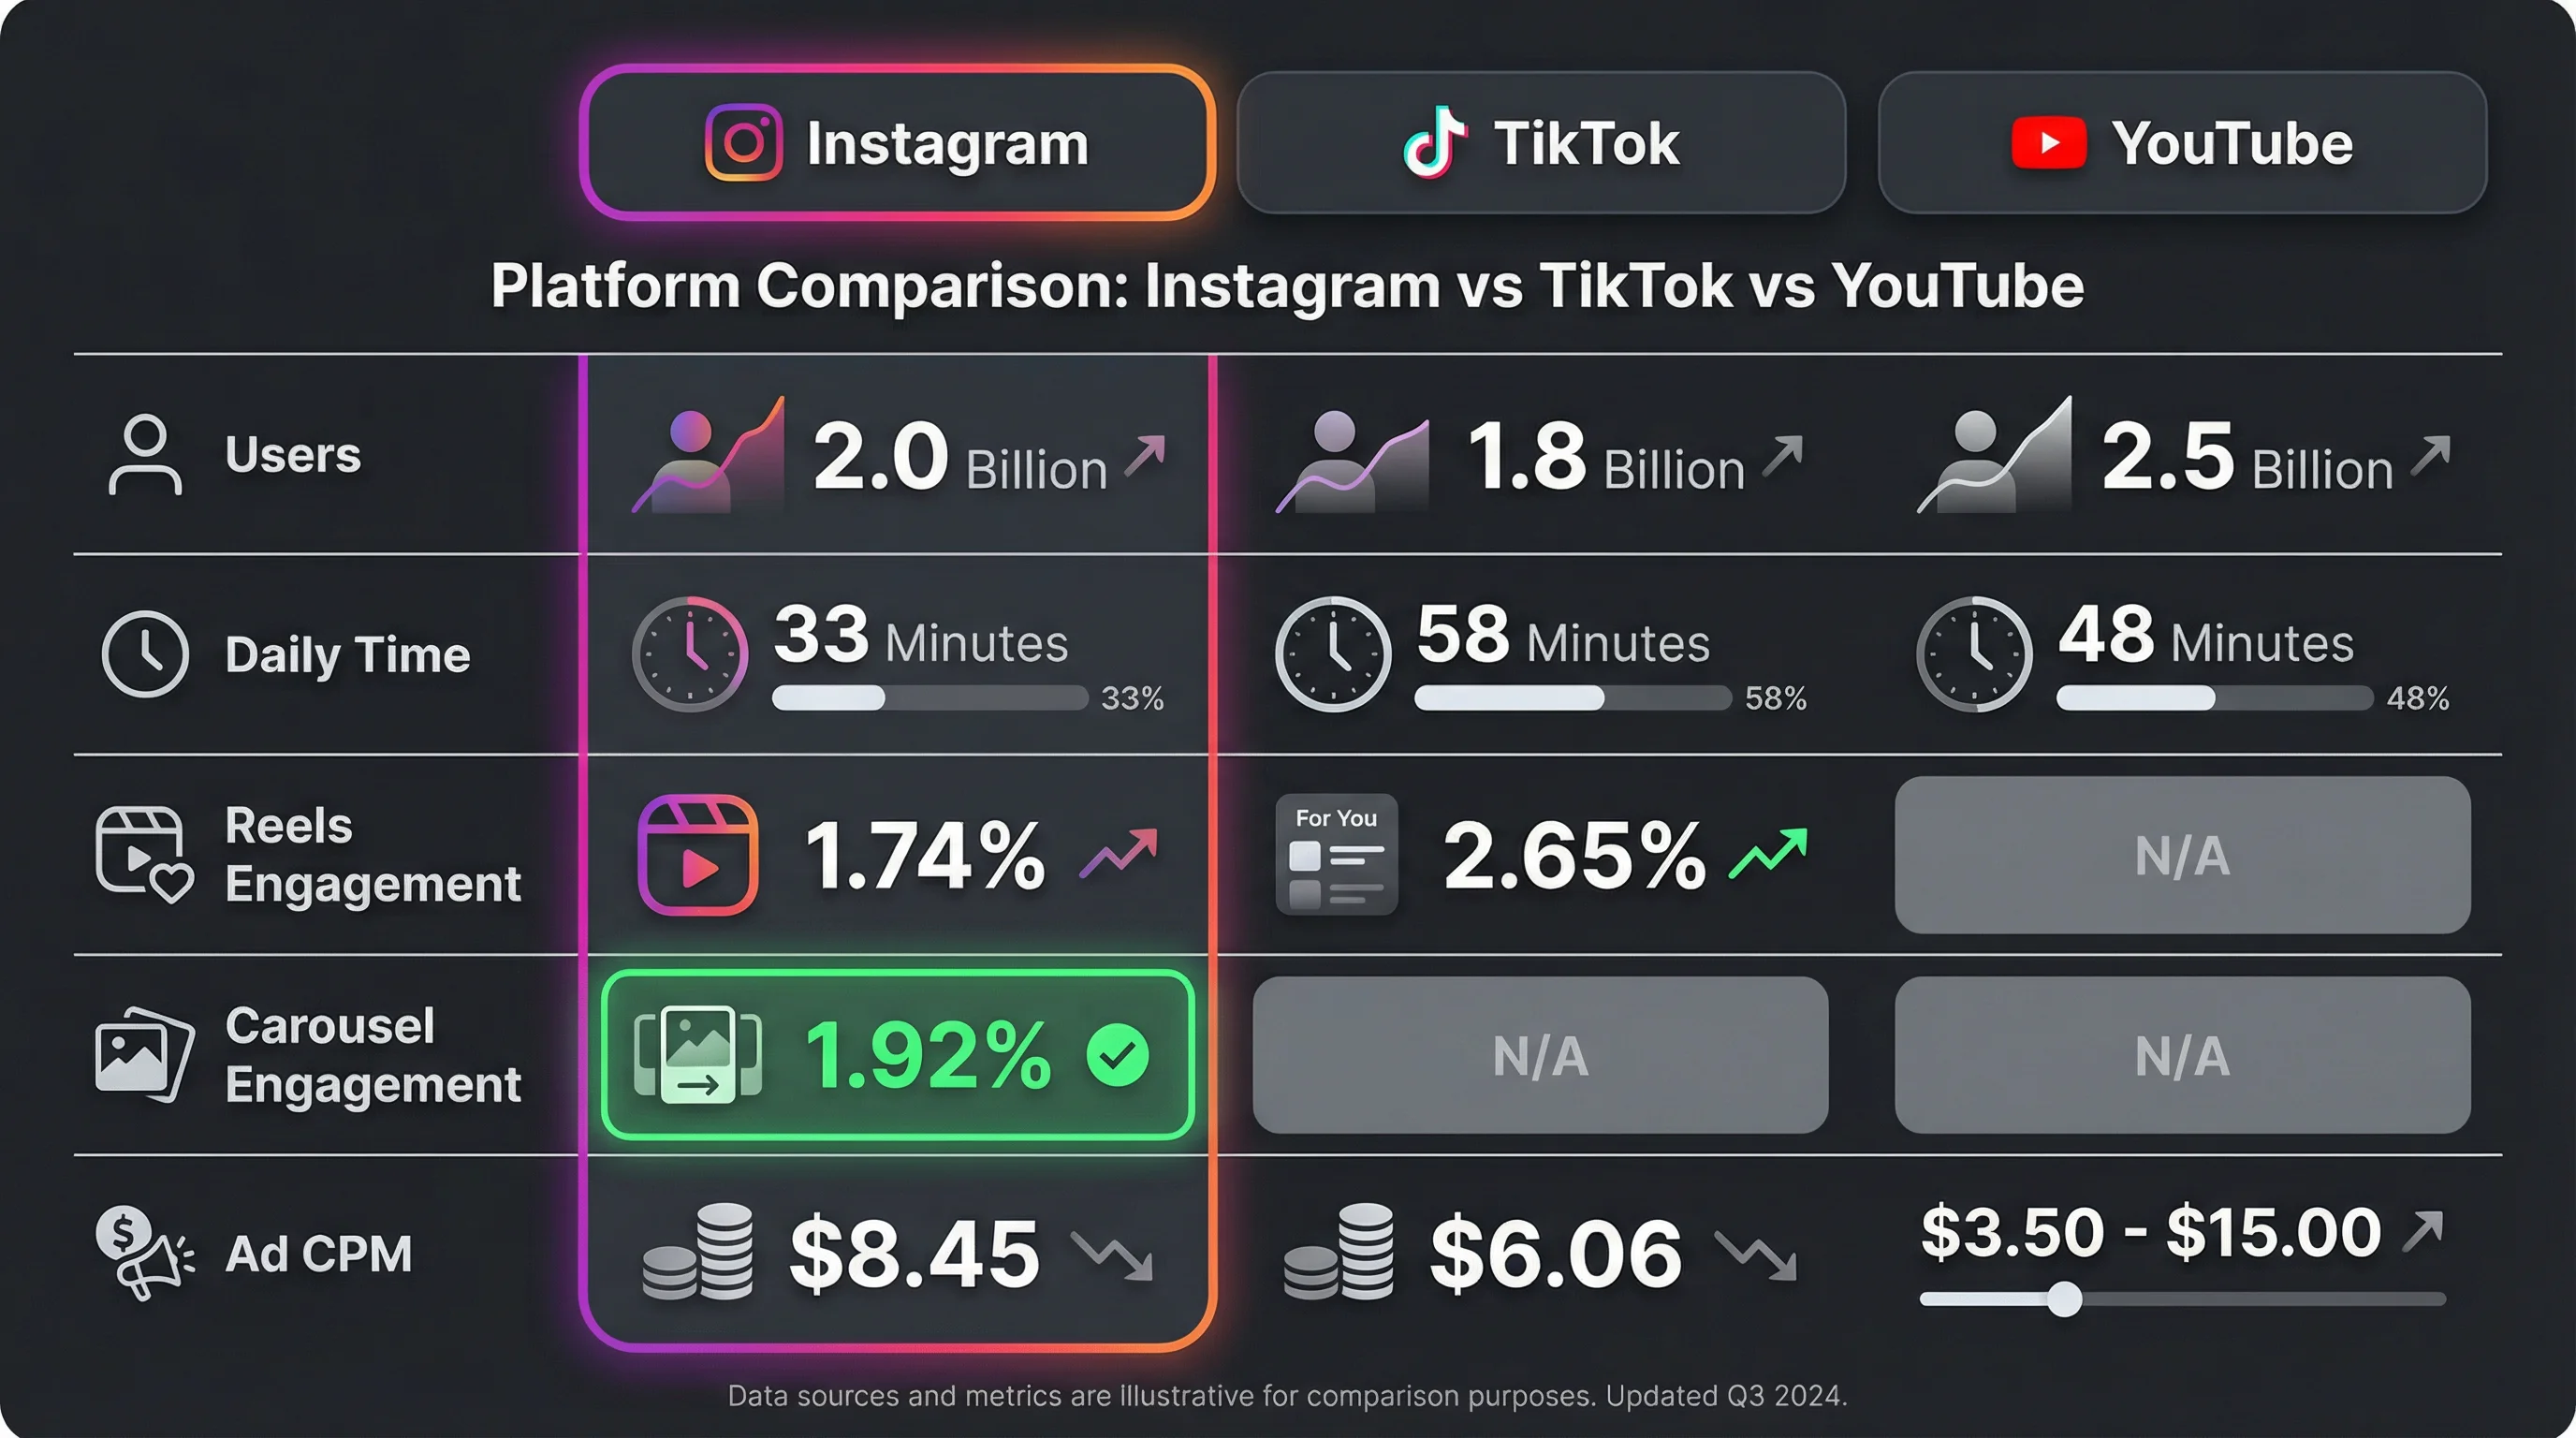
Try FlowShorts Free →Platform Comparison: Instagram vs. TikTok vs. YouTube
| Metric | TikTok | YouTube | |
|---|---|---|---|
| Monthly Active Users | 2.0 billion | 1.7 billion | 2.7 billion |
| Primary format | Reels + Feed | Short-form video | Long-form + Shorts |
| Average daily time | 33 min | 45 min | 40+ min |
| Primary audience age | 18-34 (62%) | 13-30 (majority) | 15-40 (broad) |
| Non-follower reach | High (Reels: 30.81%) | Very high (For You Page) | High (search + suggested) |
| Creator monetization | Limited native; brand deals dominate | Creator Fund + LIVE gifts | AdSense (strongest native) |
| Avg engagement rate | 1.74% (Reels) | 5-9% (higher) | Lower (views-based) |
For creators posting short-form video, cross-posting to all three platforms with the same content maximizes total reach. FlowShorts generates Reels-optimized content and auto-posts to Instagram Reels, YouTube Shorts, and TikTok simultaneously.
Sources
Statistics sourced from: Meta Q1 2026 earnings reports, DataReportal 2026 Global Social Media Report, Statista Instagram User Data (2026), Social Insider Benchmark Report 2026, Influencer Marketing Hub Creator Economy Report 2026.
Frequently Asked Questions
How many monthly active users does Instagram have in 2026?
Instagram has 2.0 billion monthly active users as of Q1 2026, with approximately 700 million daily active users. The US alone accounts for 169 million monthly active users.
What is the average engagement rate on Instagram in 2026?
The average Instagram Reels engagement rate is 1.74%. Carousels average 3.15% — the highest engagement rate of any format. Static images average 1.83%. Engagement rates vary significantly by account size — smaller accounts (1K-10K followers) typically see 3-6%, while larger accounts (1M+) see 0.3-1%.
What percentage of Instagram time is spent on Reels?
Approximately 50% of all time spent on Instagram is spent watching Reels, according to Meta's 2025 earnings reports. This represents a massive shift from 2022 when Reels accounted for only about 20% of Instagram engagement.
How much does Instagram advertising cost per 1,000 impressions?
Instagram's average CPM (cost per 1,000 impressions) is $8.45, with an average CPC of $1.28. Costs vary significantly by industry — finance and B2B software CPMs can reach $15-30, while entertainment and consumer brands typically fall in the $4-9 range.
How many creators are on Instagram?
Approximately 68 million creators are active on Instagram. Of these, around 8.5 million accounts have 10,000+ followers and qualify as influencers. Nano-influencers (1K-10K followers) make up the majority of creator partnerships due to their higher engagement rates (5-10%) and lower sponsorship costs.
Related Guides
- How the Instagram Algorithm Works in 2026
- Instagram Engagement Rate Benchmarks
- Instagram Reels Size & Dimensions Guide
- Instagram Marketing Strategy Playbook
- YouTube Statistics 2026
Turn Instagram Stats Into Instagram Reach
FlowShorts generates and auto-posts daily Reels for any niche — AI scripts, visuals, voiceover, captions, and scheduling. Reach Instagram's 2 billion MAU on autopilot.